1. string으로 변환할 때
•
시리즈 데이터
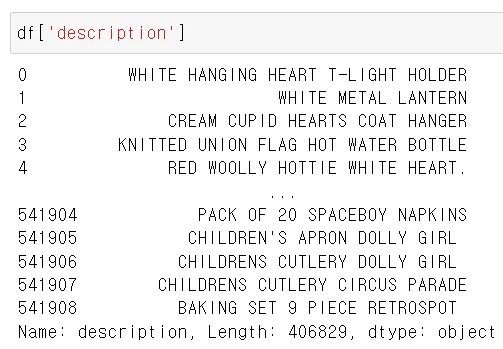
•
문자열로 aa = ''.join(list(df['description'].values))
시리즈의 value만 가져와서 리스트로 만들어서 문자열로 조인해줌
2. 단어/사용 빈도수
import collections
counts = collections.Counter(list)
#가장 많이 쓰인 단어
counts.most_common(상위 몇개)
Python
복사
4. Mapping을 활용해서 라벨링하기
df['online_order'] = df['onlin_order'].map({'yes':1, 'No':0})
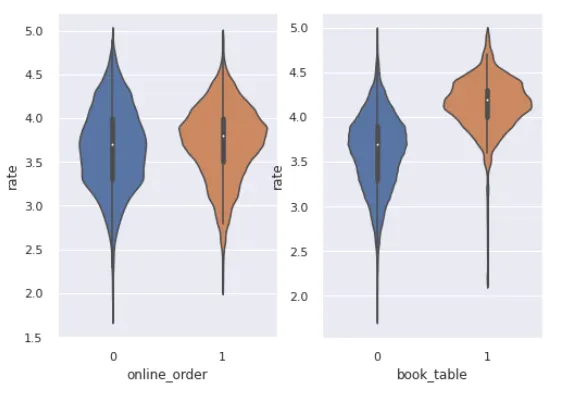
5. Violinplot
plt.subplot(1,2,1)
sns.violinplot( x = dd['online_order'], y = dd['rate'])
plt.subplot(1,2,2)
sns.violinplot( x = dd['book_table'], y = dd['rate'])
Python
복사
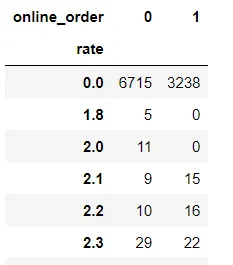
6. Crosstab
pd.crosstab(df['rate'], df['online_order'])
7. threshhold로 outlier제거
min_threshold,max_threshold= df['price'].quantile([0.01,0.99])
#백분위수로 0.01, 0.99에 있는 price 확인하기
df[df['price'] < min_threshold]
#min 404개, max 474개
#확인해보면 min outlier는 404개고 max outlier는 474개임
Python
복사
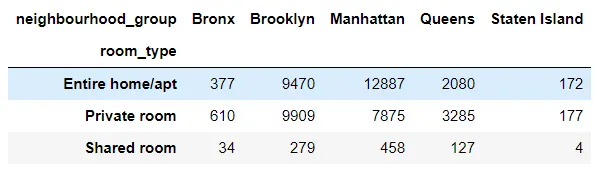
8. 2개 종류를 groupby해서 정리하기
ddf.groupby('neighbourhood_group')['room_type'].value_counts().unstack(0)
Python
복사
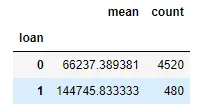
8-1. Groupby로 두 개의 값 보기
df.groupby('loan')['income'].agg(['mean','count'])
9. 정렬하기
•
DataFrame 정렬 : DataFrame.sort_values()
•
List 정렬 : list.sort(), sorted(list)
10. 가장 많은, 가장 적은 수 추리기
ddf.nlargest(10,'reviews_per_month') 가장 많은 10개
ddf.nsmallest(10,'reviews_per_month') 가장 적은 10개
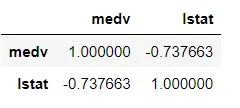
12. 상관관계 정도 보기
df[['medv', 'lstat']].corr(method = 'pearson')
df.corr(method= 'pearson')
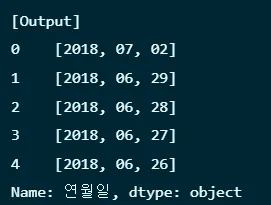
13. 컬럼 쪼개서 새로 만들기 → get
df['연월일'] = df['연월일'].astype('str')
dates = df['연월일'].str.split('-')
print(dates.head())
f['연'] = dates.str.get(0)
df['월'] = dates.str.get(1)
df['일'] = dates.str.get(2)
df.head()
Python
복사
14. 컬럼 순서 바꾸기
df1 = df1[['대여소번호', '보관소명', '대여수', '대여일자']]
15. index를 1부터 시작하기
stations_group.index = stations_group.index + 1
16. 컬럼에서 특정 값을 가진 인덱스 삭제
df1.drop(df1[df1['보관소명'] == '대여소명 없음'].index, inplace = True)
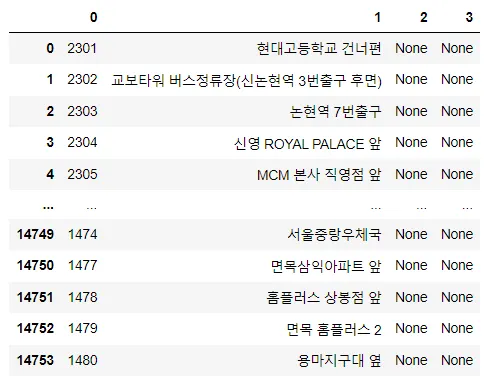
17. Split해서 두 개의 컬럼으로 만들기 expand
df1['보관소명'].str.split('.', expand = True)
18. object to datetime
df['Datetime'] = pd.to_datetime(df['Datetime'], format="%m/%d/%Y, %H:%M:%S")
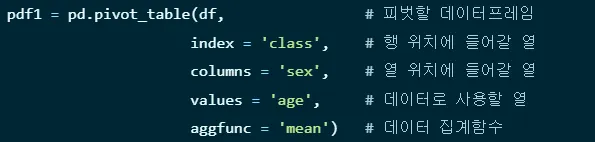
19. 피벗테이블
ddf = pd.pivot_table(df,
index = ['거래월', '거래일자'],
columns = '품목',
values = '가격',
aggfunc ='sum')
Python
복사
20. 한글깨짐
plt.rcParams['font.family'] ='Malgun Gothic'
plt.rcParams['axes.unicode_minus'] =False
Python
복사
21. 구간 나누기 cut, binning
df2['ccavg_bin'] = pd.cut(df2['ccavg'], bins = [0, 2000, 4000, 6000, 100000], labels = ['0-2', '3-4', '5-6', '7+'])
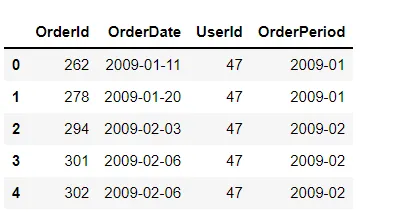
22. 년-월-일 → 년 - 월
df['OrderPeriod']=df['OrderDate'].dt.strftime('%Y-%m')
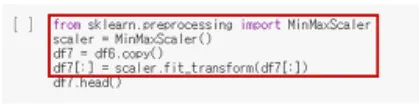
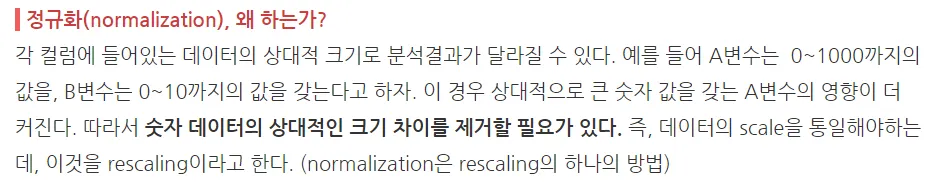
23. 데이터 정규화
from sklearn.preprocessing import MinMaxScaler
scaler = MinMaxScaler()
df[:] = scaler.fit_transform(df[:])
Python
복사
24. 군집화
from sklearn.cluster import KMeans
k = 3
# 그룹 수, random_state 설정
model = KMeans(n_clusters = k, random_state = 10)
# 정규화된 데이터에 학습
model.fit(data_scale)
# 클러스터링 결과 각 데이터가 몇 번째 그룹에 속하는지 저장
df['cluster'] = model.fit_predict(data_scale)
Python
복사
